Online Item Analysis (OIA) Report
Starting from 2014, an interactive Online Item Analysis Report has been provided for schools which have students participating in the Territory-wide System Assessment (TSA) by the Hong Kong Examinations and Assessment Authority (HKEAA). OIA is one of the modules in the Basic Competency Assessment (BCA) system. Teachers, when logging into the system, can browse not only the result data and information of their schools, but also the assessment materials (see Figure 1 to 3) such as the question papers and marking schemes in three subjects of Chinese Language, English Language and Mathematics. Together with the diagnostic information (see Figure 4) provided for each option in every single multiple-choice item, schools are able to better understand students’ overall learning performance in the sub-papers for the different learning dimensions (skills) and adjust teaching plans to improve learning and teaching.
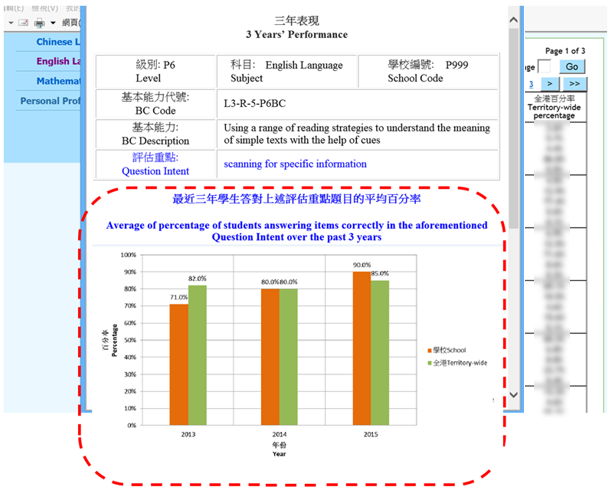
To enable teachers to analyse students’ performance more conveniently, the item analysis interface also allows teachers to view each individual item paired with its suggested answer by using the “click-on” functions. Furthermore, students’ performance in each Basic Competency/testing focus/learning unit over the past three years (see Figure 5) is also provided to facilitate schools in better understanding their students’ learning progress across the years.
To enable teachers to analyse students’ performance more conveniently, the item analysis interface also allows teachers to view each individual item paired with its suggested answer by using the “click-on” functions. Furthermore, students’ performance in each Basic Competency/testing focus/learning unit over the past three years (see Figure 5) is also provided to facilitate schools in better understanding their students’ learning progress across the years.
Figure 1: Question paper and marking scheme of each sub-paper
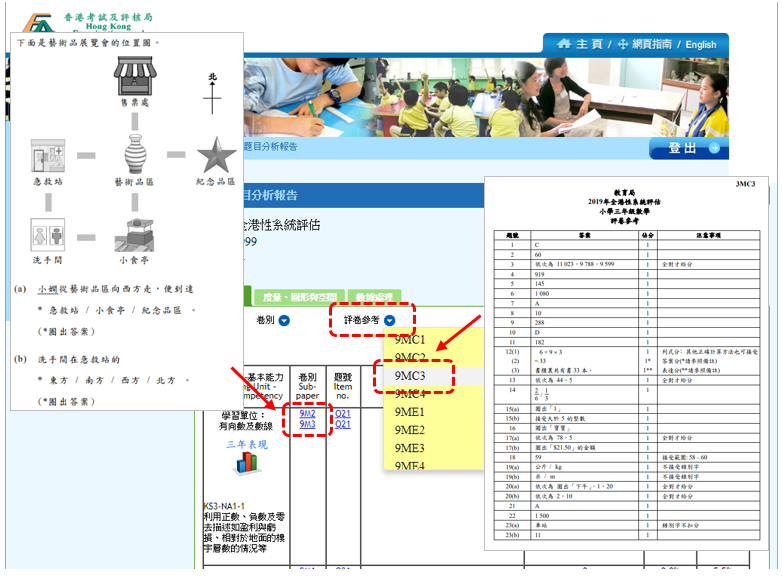
Figure 2: Tapescript of listening tasks
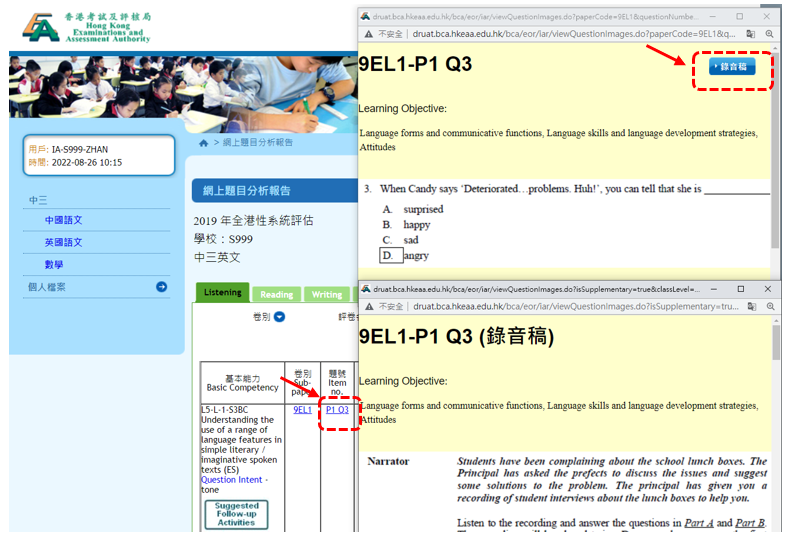
Figure 3: Exemplar in Chinese or English writing tasks
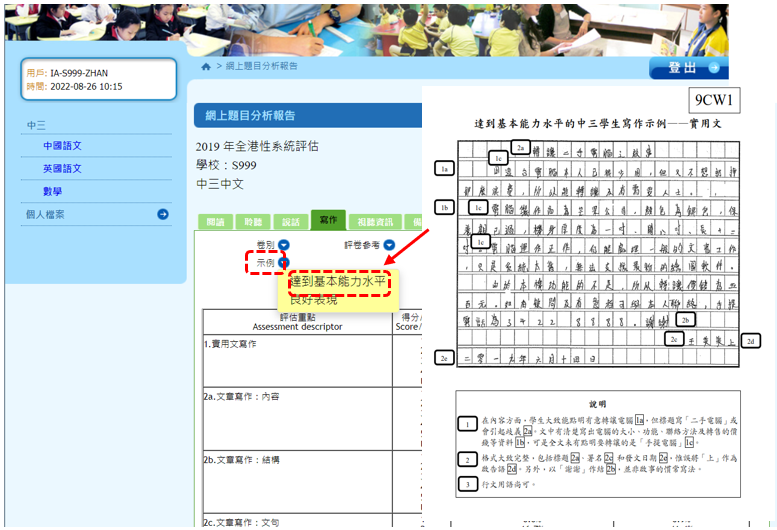
Figure 4: Diagnostic analysis of each option in multiple choice items
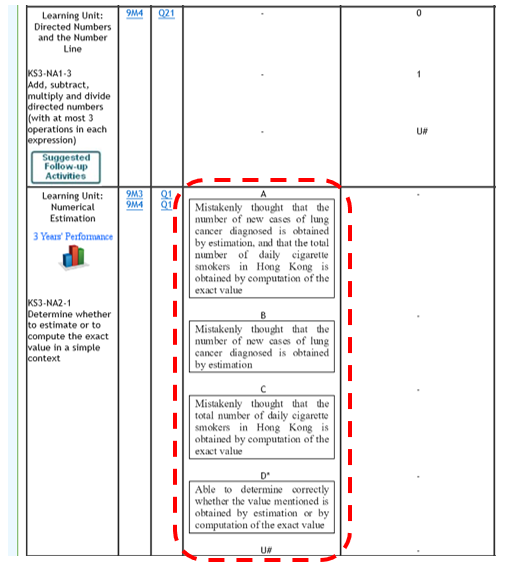
Figure 5: A Bar Chart showing student performances over the past 3 years
